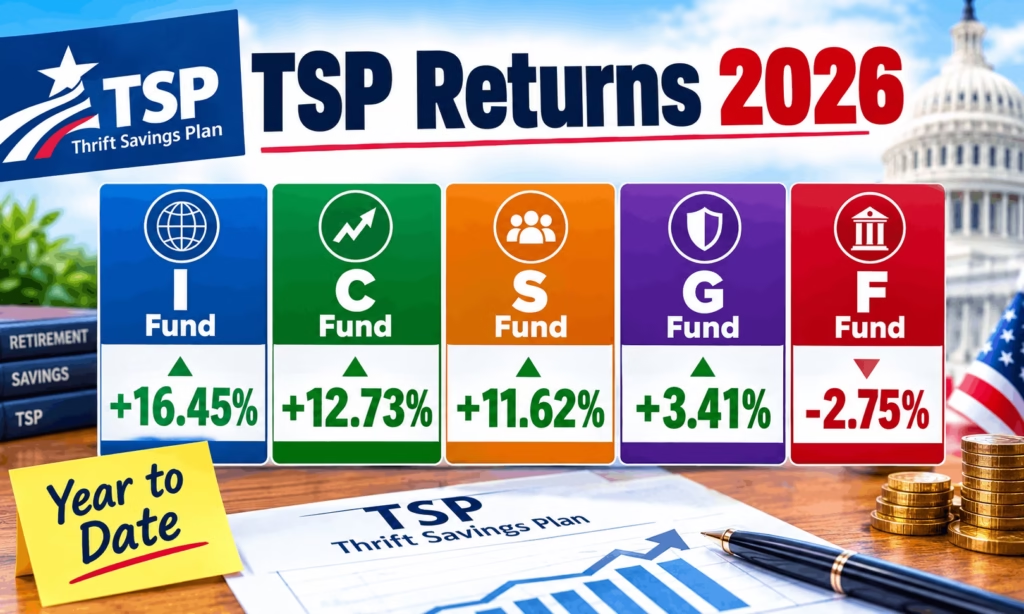
TSP Returns 2026: Federal employees and retirees opened October with a reminder that diversification cuts both ways. The latest TSP returns 2026 show only the G Fund finished September in positive territory, up 0.40 percent, while the S Fund dropped 3.86 percent, the F Fund fell 2.59 percent, the I Fund lost 2.30 percent and the C Fund slipped 0.35 percent. The slide followed the Federal Reserve’s decision to raise short-term interest rates and a stronger U.S. dollar. Even so, the year is still strong for stock funds: the I Fund is up 16.45 percent, the C Fund 12.73 percent and the S Fund 11.62 percent. The F Fund is the only core fund below zero for 2026, at negative 2.75 percent. We’ll be updating this article monthly.
The turn in September also reshuffled the leaderboard. At the end of August the S Fund was ahead of the C Fund for the year, 16.10 percent to 13.12 percent. A month later the C Fund has the edge. Lifecycle Funds all finished September in the red as well, though the shorter-dated ones held up better thanks to their G and F Fund holdings. This guide breaks down returns for every TSP fund, explains what drove the third quarter, lays out the long-term numbers, covers the 2026 contribution limits and shows when new performance data is published. A two-part calculator at the end lets you see what your money would have done in each fund and project your own balance.
TSP Returns 2026 Key Dates and Figures
| Item | Latest detail |
|---|---|
| Data through | September 30, 2026 |
| Best performer year to date | I Fund, +16.45% |
| Best performer in September | G Fund, +0.40% |
| Weakest performer in September | S Fund, -3.86% |
| Only core fund negative for 2026 | F Fund, -2.75% |
| C Fund year to date | +12.73% |
| S Fund year to date | +11.62% |
| 2026 employee contribution limit | $24,500 |
| Catch-up limits | $8,000 (age 50 and up), $11,250 (ages 60 to 63) |
| Next monthly returns | Early November 2026 for October |
| Next CPI release watched by federal retirees | October 14, 2026 |
TSP Returns September 2026: How Every Fund Performed
Here is the core fund scorecard. All figures are net of administrative and investment expenses, according to the TSP.
| Fund | July 2026 | August 2026 | September 2026 | Year to date |
|---|---|---|---|---|
| G Fund | 0.39% | 0.41% | 0.40% | 3.41% |
| F Fund | -1.29% | 0.40% | -2.59% | -2.75% |
| C Fund | -0.07% | 2.72% | -0.35% | 12.73% |
| S Fund | 4.34% | 2.27% | -3.86% | 11.62% |
| I Fund | -4.12% | 3.32% | -2.30% | 16.45% |
The pattern is easy to read. The G Fund keeps adding a steady fraction every month because it earns a statutory interest rate and carries no price risk. The F Fund is a bond index fund, so it falls when long-term interest rates rise, which is what happened in September. The C Fund tracks large and medium U.S. companies and nearly broke even. The S Fund, which holds smaller U.S. companies not found in the C Fund, took the hardest hit. The I Fund, which holds stocks from 21 developed countries, fell in part because a stronger dollar reduces the value of overseas gains for U.S. investors.
SNAP Benefits Changes: Who Is Losing Food Aid Now
Medicare Open Enrollment 2026: What to Check Before December 7
Why TSP Returns Fell in September 2026: The Fed, Rates and the Dollar
The Federal Reserve raised its target for short-term interest rates in mid-September, the first increase in more than three years according to market coverage, lifting the target range to 3.75 percent to 4.00 percent. Policymakers pointed to persistent inflation and stronger-than-expected job growth. On the day of the decision the C Fund slipped about 0.44 percent and the S Fund about 0.35 percent, and a further hike before year end was widely expected in the Fed’s own projections.
That matters for TSP participants in two ways. First, higher rates lower the price of existing bonds, which hurts the F Fund. Second, the G Fund’s rate resets with Treasury yields, so it can edge higher in the months ahead. The TSP’s own commentary notes that persistent inflation, strong employment data and geopolitical uncertainty were the key backdrop for the month.
TSP Third Quarter 2026 Returns: What July Through September Looked Like
Compounding the monthly figures above gives the third quarter picture. The G Fund added 1.20 percent. The C Fund gained 2.29 percent and the S Fund 2.59 percent, with July and August strength offsetting the September drop. The F Fund lost 3.46 percent and the I Fund lost 3.22 percent for the quarter.
| Fund | Q3 2026 (calculated from monthly returns) |
|---|---|
| G Fund | +1.20% |
| F Fund | -3.46% |
| C Fund | +2.29% |
| S Fund | +2.59% |
| I Fund | -3.22% |
| L Income | +1.40% |
| L 2030 | +0.83% |
| L 2050 | +0.54% |
| L 2060 | +0.41% |
TSP Fund Performance Long-Term: 1, 3, 5 and 10 Year Annualized Returns
Monthly numbers make headlines, but retirement accounts live on decade timelines. The TSP reports annualized returns, which means the average compound yearly return over each period.
| Fund | 1 year | 3 years | 5 years | 10 years |
|---|---|---|---|---|
| G Fund | 4.51% | 4.50% | 3.97% | 2.97% |
| F Fund | -1.77% | 4.07% | -0.57% | 1.23% |
| C Fund | 15.72% | 22.85% | 13.76% | 15.30% |
| S Fund | 11.82% | 18.73% | 6.23% | 11.19% |
| I Fund | 23.06% | 21.20% | 10.96% | 10.06% |
Two points stand out. The F Fund’s trailing 12-month return has turned negative at negative 1.77 percent, and its five-year return is also below zero, a reminder that bonds can lose money when rates climb. And the I Fund’s one-year return of 23.06 percent is the highest in the group, though its 10-year average of 10.06 percent trails both the C and S Funds.
TSP Lifecycle Fund Returns 2026: L Income Through L 2075
Lifecycle Funds mix the five core funds and shift toward the G and F Funds as the target date approaches. Every L Fund was negative in September, but returns for the year remain solidly positive.
| Fund | September | Year to date | 1 year | 3 years | 5 years |
|---|---|---|---|---|---|
| L Income | -0.28% | 6.04% | 7.88% | 9.05% | 6.10% |
| L 2030 | -0.78% | 8.92% | 11.61% | 14.70% | 8.62% |
| L 2035 | -1.02% | 10.02% | 12.92% | 15.92% | 9.14% |
| L 2040 | -1.15% | 10.59% | 13.65% | 16.93% | 9.55% |
| L 2045 | -1.25% | 11.09% | 14.29% | 17.80% | 9.87% |
| L 2050 | -1.34% | 11.62% | 14.96% | 18.67% | 10.23% |
| L 2055 | -1.48% | 13.86% | 17.70% | 21.72% | 11.78% |
| L 2060 | -1.48% | 13.86% | 17.70% | 21.72% | 11.78% |
| L 2065 | -1.48% | 13.85% | 17.70% | 21.72% | 11.77% |
| L 2070 | -1.49% | 13.85% | 17.69% | n/a | n/a |
| L 2075 | -1.49% | 13.85% | 17.69% | n/a | n/a |
L 2055 and later funds are essentially identical because they share the most aggressive allocation. Some newer funds do not yet have five or ten years of history, so the TSP lists them as not available.
What Would $10,000 in the TSP Be Worth?
Using the annualized figures above, here is what $10,000 invested at the start of each period would have grown to. This is a look backward, not a forecast.
| Fund | After 3 years | After 5 years | After 10 years |
|---|---|---|---|
| G Fund | $11,412 | $12,149 | $13,400 |
| F Fund | $11,271 | $9,718 | $11,300 |
| C Fund | $18,541 | $19,052 | $41,523 |
| S Fund | $16,737 | $13,528 | $28,884 |
| I Fund | $17,804 | $16,820 | $26,079 |
TSP Returns Calculator 2026: Check Past Growth and Project Your Balance
Part 1 applies the official annualized returns to any amount and period. Part 2 projects your balance using your salary, contribution rate, years to go and a return you choose. Experiment with a cautious number and an optimistic number, because the real result will almost certainly land somewhere in between.
Part 1: What would your money have grown to?
TSP fund (annualized returns through September 30, 2026)G FundF FundC FundS FundI FundL IncomeL 2030L 2040L 2050L 2060Time period 1 year 3 years 5 years 10 years Amount invested at the start (USD)Show historical result
Part 2: Project your TSP balance
Current TSP balance (USD)Annual salary (USD)Your contribution (percent of salary)I am covered by FERS (agency adds 1 percent plus a match of up to 4 percent)Your age this yearYears until you start withdrawingAssumed average annual return (percent)Assumed yearly salary growth (percent)Project my balance
Part 1 uses annualized net returns published by the TSP through September 30, 2026. Part 2 is a simple projection that uses 2026 contribution limits and a return you choose. Neither is a forecast, a promise or investment advice. Past performance does not guarantee future results.
Social Security COLA by State: Which Retirees Get the Biggest 2027 Raise and Why?
Trump $90 Medicare Check: Who Qualifies, When It Arrives and Why $2 Billion Is Being Redirected?
TSP Contribution Limits 2026 and How Contributions Add Up
The employee contribution limit for 2026 is $24,500, up from $23,500 in 2025, according to the IRS. Participants who turn 50 or older this year can add an $8,000 catch-up for a total of $32,500. Those who turn 60, 61, 62 or 63 get a higher catch-up of $11,250, for a total of $35,750. Beginning in 2026, catch-up contributions must go into Roth if your prior-year wages from TSP-eligible positions were above $150,000, according to the FRTIB.
| Group | Regular limit | Catch-up | Total |
|---|---|---|---|
| Under 50 | $24,500 | None | $24,500 |
| Age 50 to 59 and 64+ | $24,500 | $8,000 | $32,500 |
| Age 60 to 63 | $24,500 | $11,250 | $35,750 |
FERS employees receive an automatic 1 percent agency contribution and a match of up to 4 percent on top, so contributing at least 5 percent of pay captures the full match. Many federal planners also note that spreading contributions evenly across the year avoids missing agency matching money if you hit the limit early.
How to Open a TSP Account or Change Your Contributions?
If you are a new federal employee or service member, your agency or service sets up your account and sends login information. You then sign in to My Account at TSP.gov to choose how much to contribute, which funds to use and whether to split between traditional and Roth.
- Create or recover your login on TSP.gov using the account number from your agency or the TSP.
- Open My Account and choose Contributions or Contribution Allocation.
- Set a percentage or dollar amount per pay period.
- Pick traditional, Roth or both.
- Choose your investment mix, such as individual funds or a Lifecycle Fund.
- Review and confirm. Keep the confirmation for your records.
Reports from late January say participants can now convert traditional balances to Roth inside My Account, with a $500 minimum per conversion. Check the TSP’s own page before acting because conversion creates taxable income.
TSP Returns Release Schedule and How Long Changes Take
Share prices for each fund are updated each evening, and monthly returns usually appear at the start of the next month. October’s returns will be posted in early November. The TSP also publishes quarterly and annual numbers, plus longer-term annualized returns that sometimes lag the daily data.
| What | When it is updated |
|---|---|
| Daily share prices | Each evening after markets close |
| Monthly returns | First days of the following month |
| October 2026 returns | Early November 2026 |
| Annual returns | Early January 2027 |
| Contribution changes | Applied through your agency payroll, usually starting with an upcoming pay period |
| Interfund transfers | Processed using that day’s share prices if submitted before the daily cutoff |
Timing for contribution changes depends on your payroll office. If you need a change to take effect quickly, make it early in the pay cycle and confirm it on your next earnings statement.
Why TSP Returns Differ From the Stock Market and Bond Indexes
The C Fund tracks the S&P 500, but its return can differ slightly from the index because the TSP returns are net of fees. The S Fund tracks a broad small and mid-cap index excluding S&P 500 companies, the I Fund tracks international developed markets, and the F Fund follows a broad U.S. bond index. The TSP’s expense ratios are small, roughly 0.04 percent according to common industry summaries, which is why federal retirement specialists frequently describe the plan as low-cost.
TSP Returns and Federal Retirees: Why the 2027 COLA Matters Too
For federal retirees, investment returns are only half the story. The consumer price index used for annuities, CPI-W, was 328.481 in August, which is 3.54 percent above the third-quarter 2025 average. That is the running total toward the 2027 cost-of-living adjustment. The final number depends on July, August and September 2026 data, and the September CPI release is scheduled for October 14. FERS retirees receive a reduced COLA when inflation is above 2 percent, so the gap between inflation and the adjustment can be wider for them.
FEHB Open Season 2027 Dates: November 9 to December 14, Premiums Up 10.9% and What to Do Now
Federal Pay Freeze 2027: Who Gets No Raise and Who Gets 3.8%
How to Read TSP Returns Without Overreacting to One Bad Month
A single month is a snapshot, not a verdict. September’s declines look sharp next to August’s gains, yet the C Fund is still up 12.73 percent for the year and the S Fund 11.62 percent. The same logic works in reverse: a hot quarter does not mean the next one will repeat it. Federal planners often suggest checking three things when performance changes. First, compare your fund’s return with the matching index, not with a different asset class. Second, look at annualized returns over at least five years. Third, confirm that your mix still matches the year you plan to retire.
It also helps to remember what each fund is built to do. The G Fund is designed for stability, the F Fund for bond-market income and diversification, and the C, S and I Funds for long-term growth with bigger swings. Lifecycle Funds automate the balance and rebalance daily. Frequent moving between funds after a down month can lock in losses, so many participants set a schedule, such as an annual review, and stick with it unless their goals change.
TSP Official Links: Login, Share Prices, Returns and Planning Tools
Only enter your TSP login details on tsp.gov. The TSP will never ask you to pay to open an account or to move money by text message.
| Resource | What it is for | Link |
|---|---|---|
| TSP.gov | Login to My Account, contributions, loans, withdrawals | tsp.gov |
| TSP share prices and returns | Daily prices and published performance | Share prices and returns |
| FRTIB | Federal Retirement Thrift Investment Board that governs the plan | frtib.gov |
| OPM Retirement Services | FERS and CSRS retirement information | OPM retirement center |
| NARFE TSP and COLA updates | Monthly fund table and CPI-W tracker | NARFE up-to-date information |
| Government Executive | September 2026 TSP results coverage | GovExec report |
| FedSmith | Monthly TSP returns analysis | FedSmith report |
TSP Returns FAQs
What were TSP returns in September 2026?
The G Fund gained 0.40 percent. The F Fund fell 2.59 percent, the C Fund 0.35 percent, the S Fund 3.86 percent and the I Fund 2.30 percent.
Which TSP fund performed best in 2026?
Through September 30, the I Fund leads at 16.45 percent, followed by the C Fund at 12.73 percent and the S Fund at 11.62 percent.
Why is the F Fund negative in 2026?
Interest rates rose, and bond prices fall when rates rise. The F Fund is down 2.75 percent for the year and 1.77 percent over 12 months.
Are TSP returns net of fees?
Yes. The TSP says returns are net of accrued administrative and investment expenses.
What is the TSP contribution limit for 2026?
$24,500, plus an $8,000 catch-up for ages 50 and over or $11,250 for ages 60 to 63.
When are TSP monthly returns posted?
Typically within the first days of the next month, so October’s returns are expected in early November.
Is the G Fund guaranteed?
The G Fund invests in special Treasury securities and does not lose principal, but its returns can trail inflation and stocks over long periods.
What is the best TSP fund to be in right now?
No fund wins in every environment. The I Fund has the highest 1-year return, the C Fund has the strongest long-term record in the table above, and the G Fund is the only one with positive monthly results all year. Your choice depends on your time horizon and risk tolerance, and past results do not predict the future.
What is a good rate of return for a TSP?
That depends on your fund mix. Over the past decade the C Fund averaged 15.30 percent a year and the G Fund 2.97 percent. A Lifecycle Fund aims for a blended result that gets more conservative over time.
How much will my TSP be worth in 20 years?
It depends on contributions and returns. As an illustration, $100,000 plus $1,000 a month would grow to roughly $793,000 at 6 percent over 20 years, or about $589,000 at 4 percent. Use the calculator above for your numbers.
Can I lose money in the TSP?
Yes, in every fund except the G Fund. The F Fund’s five-year return is negative, and the S and I Funds fell sharply in September.
How are TSP returns calculated?
The TSP calculates returns from daily share prices, net of expenses, and reports monthly, annual and annualized multi-year figures.
Where can I see my personal TSP rate of return?
Sign in to My Account on TSP.gov, where the personal rate of return and account balance are available.
Conclusion: What TSP Returns 2026 Mean for Your Next Move
TSP returns 2026 tell a split story. Stocks are well ahead for the year, led by the I Fund at 16.45 percent, but September showed how quickly gains can fade when interest rates rise and the dollar strengthens. The F Fund is the lone core fund in negative territory, and the G Fund remains the steady earner. Before making changes, check your time horizon, review your fund mix in My Account and compare the long-term numbers rather than a single month. Use the calculator to test a few scenarios, keep an eye on the October 14 CPI release if you are a retiree, and look for October’s returns in early November. We’ll keep this page current as new data arrives.