
SNAP maximum monthly benefits 2026 are now in effect, running from October 1, 2025, through September 30, 2026. For the 48 contiguous states and Washington, D.C., a single-person household can receive up to $298 per month, while a family of four can receive up to $994 per month figures set annually by USDA’s Food and Nutrition Service based on the cost of the Thrifty Food Plan. It’s important to understand what “maximum” actually means: this is the ceiling amount paid only to households with little or no countable net income after deductions. Most SNAP households receive less than the maximum, because the benefit formula subtracts 30% of a household’s net monthly income from the maximum allotment for their household size. We’ll be updating this article monthly as USDA releases further FY2026 guidance and as state-level rules are refined.
Four areas — Alaska, Hawaii, Guam, and the U.S. Virgin Islands receive different, generally higher maximum allotments than the standard 48-state chart, reflecting their significantly higher food costs. Interestingly, Hawaii is the one exception moving in the opposite direction for FY2026, with its maximum allotment for a family of four actually decreasing to $1,689 even as most other regions saw increases. This guide breaks down the full FY2026 maximum benefit chart, exactly how your actual benefit is calculated, income and deduction rules, how payment timing works in different states, and where to check your balance or apply all built around verified USDA figures rather than estimates.
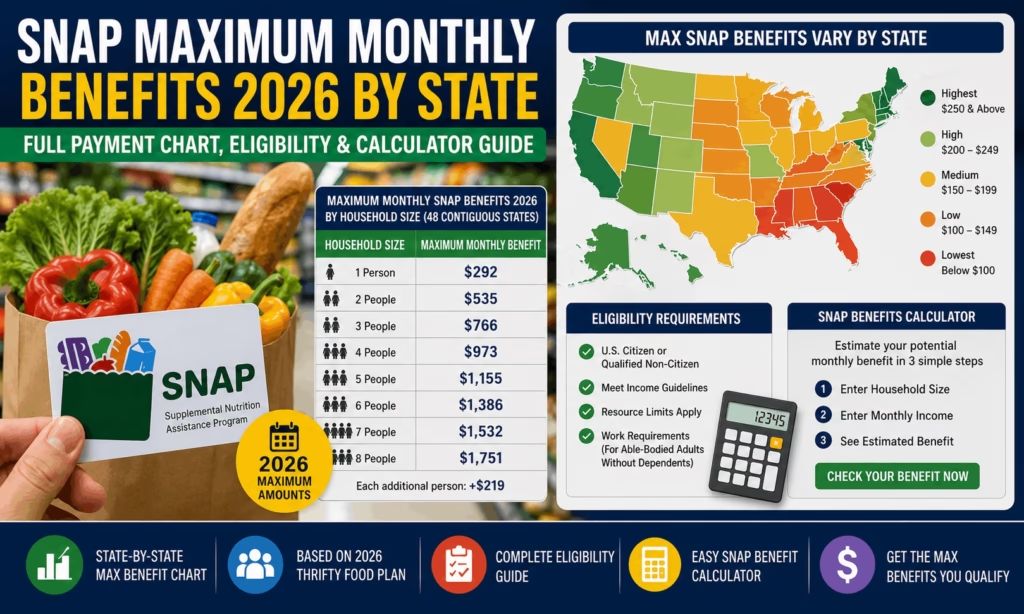
What Are SNAP Maximum Monthly Benefits 2026?
The SNAP maximum allotment is the highest monthly benefit amount a household of a given size can receive — it is not what every household actually gets. USDA’s Food and Nutrition Service (FNS) sets these ceiling amounts annually, adjusted for the cost of the Thrifty Food Plan, a model diet USDA uses to estimate a basic, nutritious food budget. A household only receives the full maximum if its net monthly income is $0 after all allowable deductions; households with any remaining net income receive a reduced amount, calculated by subtracting 30% of that net income from the maximum.
SNAP Maximum Benefit Chart 2026 (48 States & Washington, D.C.)
| Household Size | Maximum Monthly SNAP Benefit (FY2026) |
|---|---|
| 1 | $298 |
| 2 | $546 |
| 3 | $785 |
| 4 | $994 |
| 5 | $1,183 |
| 6 | $1,421 |
| 7 | $1,571 |
| 8 | $1,789 |
| Each Additional Person | +$218 |
These standard allotments apply uniformly across the 48 contiguous states and Washington, D.C. and are effective October 1, 2025 through September 30, 2026.
Which States Have Higher SNAP Benefits?
Only four U.S. jurisdictions receive different (generally higher) maximum allotments than the standard 48-state chart, due to federally recognized higher food costs:
| Region | Family-of-4 Maximum (FY2026) | Note |
|---|---|---|
| Alaska | $1,285 to $1,995 (varies by zone) | Urban, Rural I, and Rural II zones have separate, escalating allotments |
| Hawaii | $1,689 | Notably decreased for FY2026 despite most regions seeing increases |
| Guam | $1,465 | Increased for FY2026 |
| U.S. Virgin Islands | $1,278 | Increased for FY2026 |
Alaska: Zone-Based Allotments
Alaska uses a three-tier geographic system — Urban, Rural I, and Rural II — reflecting the dramatically different food transportation costs across the state. Remote Rural II locations receive close to double the standard contiguous-U.S. amount for the same household size, due to the extreme cost of shipping food to isolated communities.
Hawaii: Higher Baseline, but a 2026 Decrease
Hawaii’s SNAP allotments remain well above the 48-state standard due to persistently high food costs, but FY2026 is notable because Hawaii’s family-of-four maximum actually fell to $1,689 — a rare year-over-year decrease that runs counter to the national trend of increases.
Why Are SNAP Benefits Different in Some States?
The underlying maximum allotment amounts are federally set and identical for all 48 contiguous states — a family of four in Texas and a family of four in Maine both max out at $994. What genuinely differs state by state is not the maximum dollar chart, but:
- Income eligibility rules — some states use Broad-Based Categorical Eligibility (BBCE), raising the effective gross income limit
- Asset limit policies — states with BBCE typically waive the standard asset test
- Elderly and disabled household rules — deduction treatment can vary in state implementation
- State administration — application process, EBT card issuer, and payment scheduling method differ by state agency
- Geographic cost-of-living adjustments — applicable only to Alaska, Hawaii, Guam, and the U.S. Virgin Islands, as shown above
How SNAP Benefits Are Calculated
The core formula used nationwide is:
Monthly SNAP Benefit = Maximum Allotment − (30% × Net Monthly Income)
To get to net income, a household’s gross income is reduced by a series of allowable deductions:
- Standard deduction — $209/month for household sizes 1–3 in the 48 states and D.C. for FY2026 (higher for larger households and for Alaska, Guam, Hawaii, and the U.S. Virgin Islands)
- Earned income deduction — 20% of earned income
- Medical expense deduction — for elderly or disabled household members with medical costs above $35/month
- Dependent care (childcare) deduction — for care needed to work, look for work, or attend training/education
- Shelter deduction — rent/mortgage and utility costs above half of the household’s income after other deductions, capped at $744/month for FY2026 (48 states and D.C.), unless the household includes an elderly or disabled member, in which case there is no cap
- Homeless shelter deduction — a standard $198.99/month deduction for FY2026 for households experiencing homelessness who still have some shelter costs
Worked example: A household of 3 with $1,500 in net monthly income: 30% of $1,500 = $450. Maximum allotment for 3 people = $785. Monthly benefit = $785 − $450 = $335.
SNAP Income Limits by State
While the benefit formula is federally standardized, income eligibility limits vary by state policy, primarily through:
- Gross income limits — generally 130% of the federal poverty level, though states using BBCE can raise this to as much as 200% FPL
- Elderly/disabled household rules — many states exempt these households from the gross income test, applying only the net income test
- Broad-Based Categorical Eligibility (BBCE) — adopted by most states, this lets households already receiving certain other assistance qualify for SNAP without a separate asset test
- Asset limits — the federal standard asset limit remains $3,000 for FY2026 for households without BBCE; states with BBCE typically waive this entirely
Complete State-by-State SNAP Rules Table
| State | Allotment Basis | BBCE / Asset Limit Status | Where to Apply |
|---|---|---|---|
| Alabama | Standard 48-state chart | Check current state policy | Alabama Dept. of Human Resources |
| Alaska | Separate Alaska zone chart (higher) | Check current state policy | Alaska Div. of Public Assistance |
| Arizona | Standard 48-state chart | Check current state policy | Arizona DES |
| Arkansas | Standard 48-state chart | Check current state policy | Arkansas DHS |
| California | Standard 48-state chart | BBCE, no asset test | California CalFresh |
| Colorado | Standard 48-state chart | Check current state policy | Colorado PEAK |
| Connecticut | Standard 48-state chart | Check current state policy | CT Dept. of Social Services |
| Delaware | Standard 48-state chart | Check current state policy | Delaware DHSS |
| Florida | Standard 48-state chart | Check current state policy | Florida DCF |
| Georgia | Standard 48-state chart | Check current state policy | Georgia DFCS |
| Hawaii | Separate Hawaii chart (higher, decreased FY2026) | Check current state policy | Hawaii DHS |
| Idaho | Standard 48-state chart | Check current state policy | Idaho DHW |
| Illinois | Standard 48-state chart | Check current state policy | Illinois DHS |
| Indiana | Standard 48-state chart | Check current state policy | Indiana FSSA |
| Iowa | Standard 48-state chart | Check current state policy | Iowa HHS |
| Kansas | Standard 48-state chart | Check current state policy | Kansas DCF |
| Kentucky | Standard 48-state chart | Check current state policy | Kentucky CHFS |
| Louisiana | Standard 48-state chart | Check current state policy | Louisiana DCFS |
| Maine | Standard 48-state chart | Check current state policy | Maine DHHS |
| Maryland | Standard 48-state chart | Check current state policy | Maryland DHS |
| Massachusetts | Standard 48-state chart | Check current state policy | Massachusetts DTA |
| Michigan | Standard 48-state chart | Check current state policy | Michigan MDHHS |
| Minnesota | Standard 48-state chart | Check current state policy | Minnesota DHS |
| Mississippi | Standard 48-state chart | Check current state policy | Mississippi DHS |
| Missouri | Standard 48-state chart | Check current state policy | Missouri DSS |
| Montana | Standard 48-state chart | Check current state policy | Montana DPHHS |
| Nebraska | Standard 48-state chart | Check current state policy | Nebraska DHHS |
| Nevada | Standard 48-state chart | Check current state policy | Nevada DWSS |
| New Hampshire | Standard 48-state chart | Check current state policy | NH DHHS |
| New Jersey | Standard 48-state chart | Check current state policy | NJ DHS |
| New Mexico | Standard 48-state chart | Check current state policy | New Mexico HSD |
| New York | Standard 48-state chart | Check current state policy | NY OTDA |
| North Carolina | Standard 48-state chart | Check current state policy | NC DHHS |
| North Dakota | Standard 48-state chart | Check current state policy | ND DHHS |
| Ohio | Standard 48-state chart | Check current state policy | Ohio JFS |
| Oklahoma | Standard 48-state chart | Check current state policy | Oklahoma DHS |
| Oregon | Standard 48-state chart | Check current state policy | Oregon ODHS |
| Pennsylvania | Standard 48-state chart | Check current state policy | Pennsylvania DHS |
| Rhode Island | Standard 48-state chart | Check current state policy | RI DHS |
| South Carolina | Standard 48-state chart | Check current state policy | SC DSS |
| South Dakota | Standard 48-state chart | Check current state policy | SD DSS |
| Tennessee | Standard 48-state chart | Check current state policy | Tennessee DHS |
| Texas | Standard 48-state chart | Check current state policy | Texas HHSC |
| Utah | Standard 48-state chart | Check current state policy | Utah DWS |
| Vermont | Standard 48-state chart | Check current state policy | Vermont DCF |
| Virginia | Standard 48-state chart | Check current state policy | Virginia DSS |
| Washington | Standard 48-state chart | Check current state policy | Washington DSHS |
| West Virginia | Standard 48-state chart | Check current state policy | WV DHHR |
| Wisconsin | Standard 48-state chart | Check current state policy | Wisconsin DHS |
| Wyoming | Standard 48-state chart | Check current state policy | Wyoming DFS |
| District of Columbia | Standard 48-state chart | Check current state policy | DC DHS |
| Guam | Separate chart (higher) | Check current territory policy | Guam DPHSS |
| U.S. Virgin Islands | Separate chart (higher) | Check current territory policy | USVI DHS |
Because BBCE adoption and specific asset-limit policy can change at the state level year to year, confirm current status directly with your state agency rather than relying on any single published list, including this one.
SNAP Benefit Calculator: What Information Is Needed
To estimate your monthly benefit, you’ll need:
- Gross monthly household income
- Household size
- Monthly rent or mortgage payment
- Utility costs (or whether you qualify for a standard utility allowance)
- Child care costs, if applicable
- Out-of-pocket medical expenses, if an elderly or disabled household member has them
How Much Will a Family Receive?
- Single adult, no income: Full maximum of $298/month
- Couple with $800 net monthly income: $546 − (30% × $800 = $240) = $306/month
- Family of four with $2,000 net monthly income: $994 − (30% × $2,000 = $600) = $394/month
- Senior citizen with high medical expenses: Medical deduction lowers net income, often bringing the benefit closer to the maximum for their household size
- Disabled household: Similar benefit from medical deductions and exemption from the gross income test in most states
- Large family (7 people), low income: Could approach the $1,571 maximum for a 7-person household
SNAP Payment Schedule: How Deposit Timing Actually Works
Rather than a single fixed date, most states stagger SNAP deposits across the month, typically based on one of the following:
- The last digit of the case number or EBT card number
- The first letter of the recipient’s last name
- The recipient’s date of birth
This means two households in the same state can have completely different deposit dates depending on their case details. Because staggering methods and specific date ranges are set and updated by each state agency individually, the most reliable way to confirm an exact deposit date is through your state’s official SNAP/EBT portal or customer service line, not a generic nationwide table.
How to Check Your SNAP Balance
- EBT Edge or your state’s EBT card website — most states use a dedicated EBT balance portal
- Your state’s SNAP/benefits portal — often the same login used for applications and recertification
- State-specific mobile apps — many states now offer official EBT balance apps
- Customer service phone line — the number is printed on the back of your EBT card
- Store receipt — your remaining balance is typically printed on the receipt after an EBT purchase
How to Apply for SNAP
Applications can generally be submitted:
- Online — through your state’s benefits portal
- By phone — through your state SNAP hotline
- In person — at your local Department of Human/Social Services office
Official Resources
| Official USDA SNAP Program Page: | https://www.fns.usda.gov/snap |
| Official State SNAP Agency Directory (find your state’s current application link): | https://www.fns.usda.gov/snap/state-directory |
| USDA FY2026 COLA Memo (maximum allotments and deductions): | https://www.fns.usda.gov/snap/allotment/cola/fy26 |
| Home Page | https://govtschemes.org/ |
Common Reasons Benefits Are Lower Than Maximum
- Higher household income reducing the calculated benefit
- Incorrect or missing documents during application or recertification
- Household changes not yet reflected in your case file
- Net income calculation including income you may not have expected to count
- Fewer deductions claimed than you’re actually eligible for
Can Your SNAP Benefits Increase?
Yes — a benefit can increase when your net income decreases or your deductions increase, commonly triggered by:
- A new baby (household size increase)
- Income loss (job loss or reduced hours)
- Higher rent (increases shelter deduction, up to the cap)
- Increased medical expenses (for elderly/disabled members)
- Higher utility costs
- Household size changes generally
FAQs
What is the maximum SNAP benefit for 2026?
For the 48 contiguous states and D.C., the FY2026 maximum ranges from $298/month for one person to $994/month for a family of four, with $1,789 for eight people and +$218 for each additional household member.
Which states pay the highest SNAP benefits?
Alaska, Hawaii, Guam, and the U.S. Virgin Islands have higher maximum allotments than the standard 48-state chart due to elevated food costs, with Alaska’s remote zones paying nearly double the standard amount.
Does every state pay the same SNAP amount?
The maximum allotment chart is identical across the 48 contiguous states and D.C. Actual benefits vary household-to-household based on income and deductions, not by state policy, except in Alaska, Hawaii, Guam, and the U.S. Virgin Islands, which use separate charts.
Why does Alaska receive higher SNAP benefits?
Alaska’s food costs are significantly higher due to transportation logistics, especially in remote Rural II zones, which is why USDA sets separate, higher maximum allotments for the state.
Can I receive the maximum SNAP amount?
Only if your household’s net monthly income after deductions is $0. Most households with any income receive less than the maximum.
How are SNAP benefits calculated?
Monthly benefit = maximum allotment for your household size minus 30% of your net monthly income, after allowable deductions are subtracted from gross income.
What is the SNAP income limit?
Generally 130% of the federal poverty level for gross income, though states using Broad-Based Categorical Eligibility can raise this to as much as 200% FPL.
How can I check my SNAP balance?
Through your state’s EBT portal or app, the EBT Edge website, your state’s customer service line, or your most recent store receipt.
Which states have different SNAP rules?
All states follow the same federal benefit formula, but income limits, BBCE adoption, and asset-limit policy vary by state; Alaska, Hawaii, Guam, and the U.S. Virgin Islands also use entirely different maximum allotment charts.
How do I apply for SNAP in my state?
Through your state’s official SNAP agency — online, by phone, or in person — findable through USDA’s official state agency directory.
Q4.
Q5.
Q6.
Q7.
Q8.
Q9.
Q10.
People Also Ask
How much is the maximum food stamp benefit for a family of 4 in 2026?
$994 per month in the 48 contiguous states and D.C. for FY2026, though Alaska, Hawaii, Guam, and the U.S. Virgin Islands have higher family-of-four maximums.
Why did my SNAP benefit go down even though the maximum went up?
Because your actual benefit depends on your net income relative to the new maximum — an increase in your income or a decrease in your deductions can lower your benefit even in a year the federal maximum rises.
Does SNAP pay more in Hawaii than the mainland?
Yes, though Hawaii’s FY2026 maximum for a family of four actually decreased to $1,689, even as it remains well above the 48-state standard of $994.
What’s the difference between gross income and net income for SNAP?
Gross income is total household income before any deductions; net income is what remains after subtracting allowable deductions like the standard deduction, earned income deduction, medical expenses, and shelter costs — net income is what the 30% benefit reduction is calculated against.
Key Takeaways
- FY2026 maximum allotments run October 1, 2025 through September 30, 2026: $298 (1 person) up to $994 (4 people), $1,789 (8 people), +$218 per additional person.
- Alaska, Hawaii, Guam, and the U.S. Virgin Islands use separate, generally higher allotment charts.
- Formula: Maximum allotment − 30% of net monthly income = monthly benefit.
- Standard deduction FY2026: $209 (household sizes 1–3, 48 states/D.C.); asset limit: $3,000 without BBCE.
- Payment dates are staggered by state, not fixed — check your state’s official portal for your specific deposit date.