
Social Security cuts in 2032 would hit every state, but a new state-by-state breakdown shows the pain would land very unevenly. The Committee for a Responsible Federal Budget projects that if Congress does not act before the retirement trust fund’s reserves run out, benefits would need to be cut by roughly 24%, and the CRFB has now modeled exactly what that means state by state, both in dollars lost per household and in the share of each state’s economy that disappears with it. West Virginia, Mississippi and Vermont top the list measured against state GDP, while Connecticut, New Jersey and New Hampshire would see the largest dollar-amount cuts to individual monthly checks. We’ll be updating this article monthly.
The urgency is not hypothetical. The 2026 Social Security Trustees Report, released in June, projects that the Old-Age and Survivors Insurance trust fund will be depleted in the fourth quarter of 2032, one quarter earlier than the prior year’s estimate, at which point incoming payroll tax revenue would cover only about 78% of scheduled benefits, a 22% across-the-board reduction under current law. Nationally, that would drain an estimated $345 billion from the economy in a single year, equal to about 1.1% of US GDP, but the localized impact in the hardest-hit states runs nearly double the national average. Below is the full list of the 10 states facing the biggest economic exposure, the states facing the largest dollar-amount cuts, a calculator to look up your own state, and what Congress could still do to prevent it.
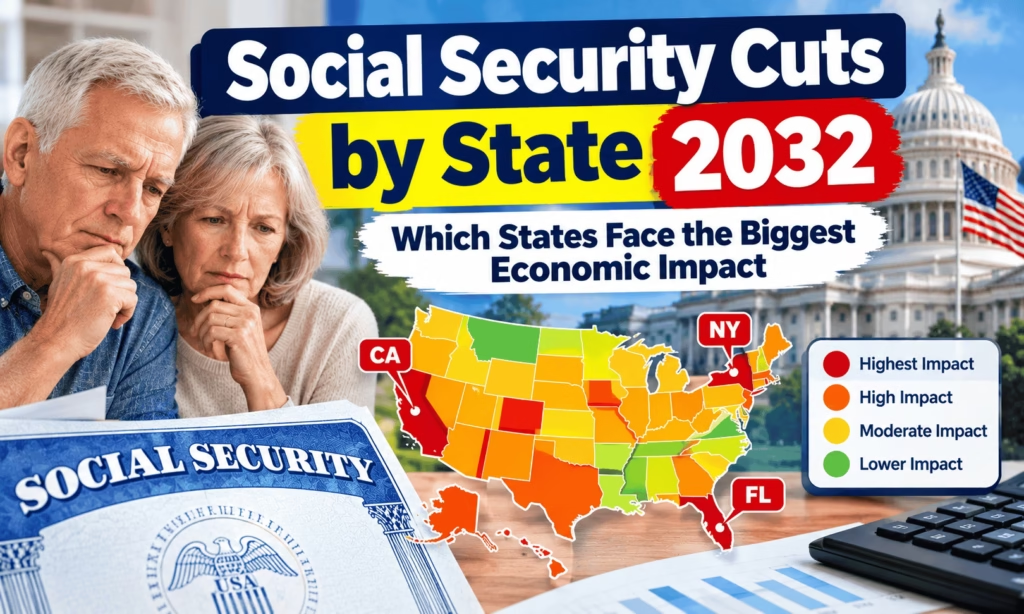
Social Security Cuts by State 2032: The 10 Hardest-Hit States by GDP Impact
When measured against the size of each state’s economy rather than raw dollars, the states with older populations and lower per-capita incomes bear the brunt of the projected cuts.
| Rank | State | Estimated loss as share of GDP |
|---|---|---|
| 1 | West Virginia | 1.9% |
| 2 | Mississippi | 1.8% |
| 3 | Vermont | 1.8% |
| 4 | South Carolina | 1.7% |
| 5 | Maine | 1.7% |
| 6 | Michigan | 1.6% |
| 7 | Montana | 1.6% |
| 8 | Arkansas | 1.6% |
| 9 | Alabama | 1.6% |
| 10 | Idaho | 1.5% |
The national average sits at 1.1% of GDP, and the CRFB projects that 40 states in total would see cuts exceeding 1% of their state economy. A 1.9% figure for West Virginia does not mean the state’s entire economy shrinks by that amount; it means the Social Security payments that would disappear equal 1.9% of the state’s annual economic output, a meaningful shock concentrated in retail spending, healthcare and housing markets where retirees spend most of their benefit income.
Social Security Cut Lookup: Find Your State’s Projected Impact
Social Security Cut Lookup: Find Your State’s Projected Impact
Estimate what the projected automatic benefit cut could mean in dollars if Congress does not act before the trust fund shortfall hits.
Why Some SSI Recipients Get Two Payments in October 2026?
$2400 Social Security Increase: What the Proposed $200 Monthly Boost Really Means
Social Security Payment Dates October 2026: Full Schedule By Birthday, SSI Quirk and COLA Update
States Facing the Largest Dollar-Amount Cuts to Monthly Checks
Measured in raw dollars rather than GDP share, a different set of states tops the list, largely because these states pay higher average Social Security benefits, so a flat 24% cut removes more from each check.
| Rank | State | Projected monthly cut |
|---|---|---|
| 1 | Connecticut | $556 |
| 2 | New Jersey | $554 |
| 3 | New Hampshire | $553 |
| 4 | Delaware | $549 |
| 5 | Maryland | $541 |
| 6 | Washington | $523 or more |
| 7 | Minnesota | $523 or more |
| 8 | Massachusetts | $523 or more |
| 9 | Michigan | $523 or more |
| 10 | Utah | $523 or more |
The CRFB found that average monthly cuts would exceed $500 in 29 states in total under its 24% scenario, with the national average cut landing at $500 a month. The pattern is clear: Northeastern states, where average benefits already run higher than the national figure, see the deepest dollar losses even though their populations are not always the most reliant on Social Security as a share of income.
Why These Two Rankings Look So Different
Dollar-amount rankings and GDP-share rankings measure different things, which is why Connecticut and West Virginia can both be described as “hit hardest” without contradiction. Connecticut’s higher average benefit means a flat percentage cut removes more dollars per check, but Connecticut’s larger, more diversified economy can absorb that loss more easily in relative terms. West Virginia’s average benefit is lower in raw dollars, but Social Security income makes up a larger share of the state’s overall economic activity, so the same relative cut does proportionally more damage to local spending, tax revenue and business income.
| Measure | What it captures | States it highlights |
|---|---|---|
| Dollar amount per check | How much an individual retiree’s monthly payment would shrink | Higher cost-of-living states with higher average benefits: Connecticut, New Jersey, New Hampshire |
| Share of state GDP | How much the state’s overall economy depends on Social Security spending | Lower-income, older-population states: West Virginia, Mississippi, Vermont |
Key Dates and Highlights: The Path to 2032
| Date | Milestone |
|---|---|
| June 2025 | Prior Trustees Report projects OASI trust fund depletion in 2033 |
| June 9, 2026 | 2026 Trustees Report moves the depletion estimate one quarter earlier, to Q4 2032 |
| Q4 2032 (projected) | OASI trust fund reserves are projected to be exhausted absent congressional action |
| After depletion | Incoming payroll tax revenue covers about 78% of scheduled benefits, a roughly 22% cut under current law |
| Combined OASDI funds | Retirement and disability funds combined are projected to last until Q3 2034, paying about 83% of benefits after that point |
Which States Have the Most Vulnerable Seniors?
Beyond GDP share and dollar amounts, some analysts focus on which states have the largest proportion of their population directly affected. Maine leads this measure, with an estimated 22.9% of its total population, about 300,000 people, likely to feel a direct impact from cuts, followed closely by West Virginia at 22.4% of its population, or roughly 400,000 people. These figures reflect how large a share of each state’s residents currently receive Social Security, combined with how economically dependent that population is on the program relative to other income sources.
States with a higher cost of living compound the problem even where dollar cuts are smaller. A retiree in a lower-benefit state may see a smaller nominal reduction than someone in Connecticut, but if that retiree’s benefit already covers a larger share of a tight household budget, the practical impact of even a modest percentage cut can be more severe.
$100000 Social Security Benefits Per Year: How Married Couples Actually Reach It in 2026
Medicare Part D Premium 2027 New Rates Announced, How Much Will You Pay?
2027 Social Security COLA Forecast: Latest 3.6% Estimate and How Much Retirees Could Get
The Regional Pattern Behind the Numbers
Looking at both lists together reveals a clear regional split. States facing the steepest GDP-share impact cluster in Appalachia and the Deep South, West Virginia, Mississippi, Arkansas, Alabama, along with a few rural New England and Mountain West states like Vermont, Maine, Montana and Idaho. These states share a common profile: older populations, lower median household incomes, and economies where retail spending and local services depend disproportionately on steady, predictable income sources like Social Security checks.
States facing the largest dollar-amount cuts cluster instead in the Northeast corridor, Connecticut, New Jersey, New Hampshire, Delaware, Maryland, plus scattered higher-cost states like Washington and Massachusetts. These states generally have higher average lifetime earnings, which translates into higher average Social Security benefits, and therefore a larger absolute dollar reduction under a flat percentage cut, even though the same cut represents a smaller share of these states’ larger, more diversified economies. Understanding which list matters more for a given state depends on whether the concern is household-level financial strain or broader regional economic disruption.
What Is Causing the Social Security Shortfall?
Social Security’s core financing problem is demographic and structural, not a sudden policy failure. Retiring Baby Boomers are drawing benefits faster than a shrinking working-age population can replenish payroll tax revenue, and people are living longer, drawing benefits over more years than the program’s original design anticipated. Falling birth rates and reduced net immigration have further slowed the growth of the tax-paying workforce, while rising wage inequality has meant more earnings escape Social Security taxation above the annual taxable maximum, currently $184,500 in 2026.
The Trustees have flagged that recent tax law changes reducing revenue collected on benefits, combined with weaker projected immigration levels, contributed to the 2026 report’s one-quarter-earlier depletion estimate compared with the prior year. None of these factors are new, but their cumulative effect has steadily narrowed the window Congress has to act before automatic cuts take effect under current law.
Can Congress Still Prevent the 2032 Social Security Cuts?
Yes, and lawmakers have several tools available, though none has passed as of this update. Options frequently discussed include raising or eliminating the payroll tax cap above the current $184,500 taxable maximum, gradually raising the payroll tax rate, adjusting the full retirement age for future retirees, and changing the cost-of-living adjustment formula. Congress has acted on Social Security’s financing before, most notably in 1983, when a bipartisan deal raised the retirement age and payroll taxes to extend solvency for decades. The automatic 2032 cut is not inevitable; it is what current law requires only if no legislative fix passes before the trust fund’s reserves are exhausted.
Local Economic Ripple Effects Beyond Retirees
The economic impact of a Social Security cut would not stay contained to retiree households. Because most beneficiaries spend the bulk of their monthly check quickly on groceries, prescriptions, utilities and rent, that money circulates directly through local businesses, particularly in the small towns and rural counties where a hardest-hit state like West Virginia or Mississippi has a higher concentration of retirees relative to working-age residents. A sudden 22% to 24% reduction in that spending stream would ripple through grocery stores, pharmacies, healthcare providers and property markets in those communities, potentially triggering secondary effects like reduced local tax revenue and slower small-business hiring.
Healthcare providers face a particular exposure, since many rely on a steady base of Medicare and Social Security-funded patients for predictable revenue. Rural hospitals, already operating on thin margins in several of the hardest-hit states, could see collections slow if patients delay elective care or struggle to cover co-pays after a benefit reduction. State and local governments would also feel indirect pressure, since reduced consumer spending typically lowers sales tax collections, compounding budget challenges in states that already rank among the nation’s lower-revenue jurisdictions.
How to Check Your Own Social Security Benefit and Prepare
- Sign in to your my Social Security account at ssa.gov to see your current estimated benefit and full earnings history.
- Model your own household budget against both the current benefit and a hypothetical 22% to 24% reduction to see the practical gap you might need to cover.
- Diversify retirement income where possible, since relying solely on Social Security leaves a household more exposed to any future benefit reduction.
- Track Trustees Report updates each year, typically released in the spring or early summer, since the depletion date and projected cut percentage can shift.
- Contact your congressional representatives if you want to weigh in on proposed Social Security financing reforms before any changes are finalized.
Social Security COLA 2027 by State: These 10 States Could See the Biggest Dollar Increase
Social Security Payment Schedule: What Stays the Same Until 2032
Nothing about today’s payment schedule or amounts changes because of this projection. Current benefits continue to be paid in full under existing rules, following the standard schedule below, and annual cost-of-living adjustments continue to apply until and unless the trust fund is actually depleted without a legislative fix.
| Recipient group | Payment pattern |
|---|---|
| SSI | 1st of the month, shifted earlier for weekends or federal holidays |
| Started before May 1997, or receiving both SSI and Social Security | 3rd of the month |
| Birthday 1st to 10th | Second Wednesday of the month |
| Birthday 11th to 20th | Third Wednesday of the month |
| Birthday 21st to 31st | Fourth Wednesday of the month |
Official Resources on Social Security’s Financial Outlook
| Resource | Use it for | Link |
|---|---|---|
| my Social Security account | Login, registration and your personal benefit estimate | ssa.gov/myaccount |
| 2026 Trustees Report summary | Official trust fund projections and depletion dates | ssa.gov/oact/trsum |
| Full Trustees Report | Complete financial and actuarial data | ssa.gov/oact/tr |
| Benefit calculators | Estimating your own future benefit | ssa.gov/benefits/calculators |
| Committee for a Responsible Federal Budget | State-level cut analysis and budget research | crfb.org |
| Congressional Budget Office | Independent federal budget and Social Security projections | cbo.gov retirement topics |
| Contact Congress | Finding and contacting your representatives | congress.gov contact us |
FAQs About the 2032 Social Security Cuts
Which states will be hit hardest by Social Security cuts in 2032?
Measured against state GDP, West Virginia, Mississippi and Vermont face the largest impact, followed by South Carolina, Maine, Michigan, Montana, Arkansas, Alabama and Idaho, according to the Committee for a Responsible Federal Budget’s analysis.
How much could my Social Security check be cut in 2032?
The 2026 Trustees Report projects a roughly 22% cut if the trust fund is depleted with no congressional action, while the CRFB’s modeled scenario using slightly older data projects about 24%, averaging a $500 monthly reduction nationally, with cuts exceeding $500 a month in 29 states.
Is a Social Security benefit cut definitely happening in 2032?
No. This is a projection under current law if Congress takes no action before the trust fund’s reserves are depleted in the fourth quarter of 2032. Congress has multiple tools available to prevent it, and has acted on Social Security financing before, notably in 1983.
Why do Connecticut and West Virginia both appear on ‘hardest hit’ lists?
They measure different things. Connecticut has the largest dollar-amount cut because it has a higher average benefit, so a flat percentage cut removes more dollars per check. West Virginia has the largest GDP-share impact because Social Security income makes up a larger portion of its overall state economy.
What happens to the Social Security trust fund in 2032?
The Old-Age and Survivors Insurance trust fund is projected to be depleted in the fourth quarter of 2032. After that point, incoming payroll tax revenue would cover only about 78% of scheduled benefits under current law, without further congressional action.
What can Congress do to prevent the 2032 Social Security cuts?
Options under discussion include raising or eliminating the payroll tax cap, gradually increasing the payroll tax rate, adjusting the retirement age for future retirees, and changing the cost-of-living adjustment formula. None of these have passed as of this update.
What is the Social Security trust fund depletion date?
The 2026 Social Security Trustees Report projects the Old-Age and Survivors Insurance trust fund will be depleted in the fourth quarter of 2032, one quarter earlier than the prior year’s estimate.
Which states have the most seniors dependent on Social Security?
Maine has the highest estimated share of its population directly affected by potential cuts, at about 22.9%, or 300,000 people, followed by West Virginia at 22.4%, or about 400,000 people.
How much money would be lost nationally if Social Security is cut?
The CRFB estimates a 24% reduction would drain roughly $345 billion from the US economy in a single year, equal to about 1.1% of national GDP.
Will Social Security disappear completely in 2032?
No. Social Security would continue operating and paying benefits from ongoing payroll tax revenue even after trust fund depletion; only the funded portion beyond incoming revenue would be affected, resulting in a percentage reduction rather than a complete stop in payments.
How is the Social Security shortfall calculated?
The Social Security Board of Trustees calculates the shortfall each year by comparing projected program income, mainly payroll taxes, against projected benefit obligations over a 75-year horizon, publishing the results in an annual Trustees Report.
Conclusion
Social Security cuts in 2032 remain a projection under current law, not a scheduled certainty, but the state-by-state breakdown shows why the stakes vary so much by geography. West Virginia, Mississippi and Vermont face the deepest relative economic damage, while Connecticut, New Jersey and New Hampshire would see the largest dollar-amount reductions to individual checks. Use the lookup tool above to see your own state’s exposure, and remember that Congress retains multiple tools to prevent the automatic reduction before the trust fund’s reserves run out. We will refresh this guide’s figures every month and whenever new Trustees Report or CRFB data is released.
2027 COLA: How Much Will Your Social Security Check Increase?
Social Security October 2026 Payments: Why SSI Gets Two Checks?
$255 Social Security Death Benefit: Who Actually Qualifies and How to Apply?