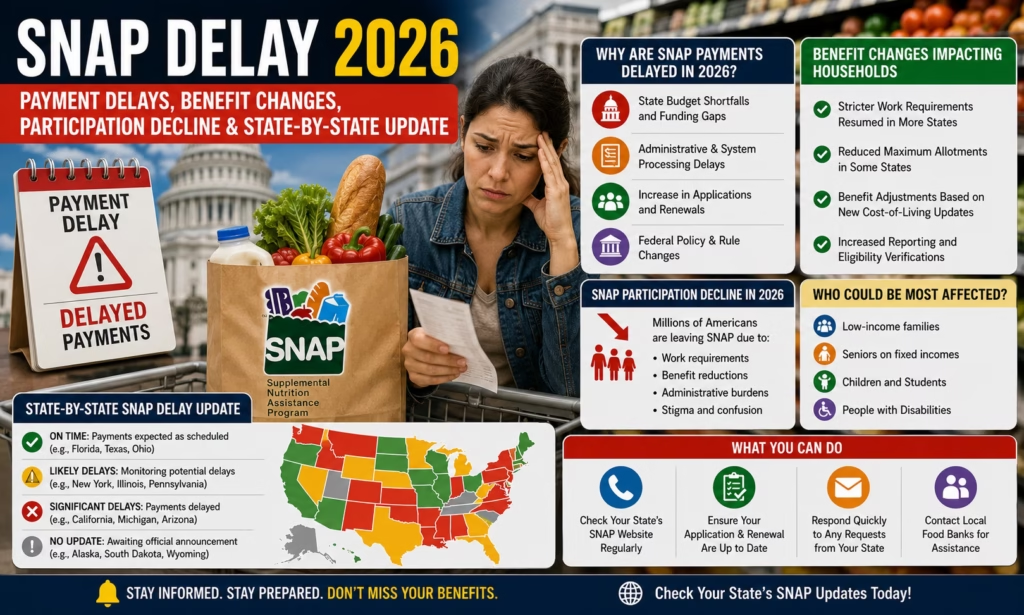
The nationwide SNAP delay 2026 situation is really two overlapping stories: individual households experiencing late payments because of recertification backlogs and stricter verification rules, and a much larger structural decline in the overall program, with USDA figures showing participation falling from approximately 42.2 million recipients in March 2025 to about 37.3 million by March 2026, a drop of nearly 5 million people in one year. Most of that decline traces directly back to the One Big Beautiful Bill Act (OBBBA), signed July 4, 2025, which expanded the SNAP work requirement age range from 18-54 up to 18-64 and removed exemptions that previously protected veterans, people experiencing homelessness, former foster youth, and caregivers of children aged 14 and older. The Congressional Budget Office estimates these changes will cut federal SNAP spending by roughly $186 billion over the next decade, largely by removing an estimated 2.4 million people from the program in an average month. We’ll be updating this article monthly so SNAP households and applicants always have the latest confirmed delay causes, participation figures, and state-by-state data in one place.
This guide breaks down exactly why so many households are experiencing a SNAP payment delay this year, the full scale of the national enrollment decline state by state, and precisely which OBBBA provisions are driving both the delays and the drop in participation. It also covers practical steps to avoid becoming one of the delayed cases, the federal timeliness rules states are required to follow, and where to find every official resource you need if your benefits are late or your case has been flagged for review. If your SNAP payment has not arrived on schedule, or you are trying to understand why enrollment nationwide has fallen so sharply, this breakdown addresses exactly what is happening and why.
SNAP Delay 2026 Summary
| Detail | Information |
|---|---|
| National SNAP participation, March 2025 | Approximately 42.2 million recipients |
| National SNAP participation, March 2026 | Approximately 37.3 million recipients |
| Total decline | Roughly 4.9 million people (about 12%) |
| Law driving the decline | One Big Beautiful Bill Act (OBBBA), signed July 4, 2025 |
| CBO estimated 10-year federal spending reduction | Approximately $186 billion |
| CBO estimated average monthly participation reduction from work rules | Approximately 2.4 million people |
| New ABAWD age range | 18-64 (up from 18-54) |
| Full state compliance deadline | November 1, 2025 |
| Federal recertification timeliness standard | 95% of cases processed on time (RPT rate) |
| State with steepest percentage decline | Arizona, over 50% |
National SNAP Participation Decline: 42.2 Million to 37.3 Million
USDA data confirms that SNAP participation fell from roughly 42.2 million people in March 2025 to about 37.3 million by March 2026, one of the largest single-year drops in the program’s history. Enrollment held comparatively steady above 42 million through the first half of 2025, falling by only about 800,000 people between January and July of that year. The real decline accelerated after OBBBA’s passage in July 2025, with participation dropping by roughly 3.4 million more people between August 2025 and January 2026 alone, as states rolled out the law’s new eligibility and work-requirement rules. A Center for American Progress analysis of USDA and state agency data found that participation rates dropped in every state, with declines of 5% or more in 42 states and 10% or more in 21 states.
| Decline Severity | Number of States Affected |
|---|---|
| Any decline in participation | 49 states (every state except Guam, which rose about 2%) |
| Decline of 5% or more | 42 states |
| Decline of 10% or more | 21 states |
| Decline of 50% or more | 1 state (Arizona) |
Why SNAP Payments Are Delayed in 2026
Beyond the national enrollment decline, a large number of remaining SNAP recipients are experiencing an actual SNAP delay in their monthly payment. The most common causes include:
- Recertification backlogs: Households whose eligibility renewal was due but not completed on time can see their benefits temporarily paused until the case is updated, and state caseworkers are processing a higher volume of these reviews than usual as OBBBA’s rules take full effect.
- Work requirement verification: Even recipients who qualify for an exemption from the expanded ABAWD rules still need that exemption verified by the state, and this additional review step has created backlogs in many state systems.
- Case changes: Reporting a change in income, employment, or household size triggers a review, and payments can be held until that review is finalized.
- System and processing delays: Some states have experienced software updates, EBT vendor outages, or high application volume that slow down monthly issuance, particularly early in the month when the largest share of cases process at once.
Federal rules require states to process at least 95% of recertification applications on time, a standard known as the Recertification Processing Timeliness (RPT) rate. States that consistently fall below this threshold face an escalating series of federal warnings and, eventually, a risk to their federal administrative funding, though enforcement and correction can take months to show results at the household level. The table below shows how that escalation process works when a state’s timeliness rate falls short.
| Escalation Step | What Happens |
|---|---|
| Step 1: Advanced warning letter | State is notified its timeliness rate is falling short and given a chance to self-correct |
| Step 2: Formal warning letter | State is warned that federal administrative funds are at risk if benchmarks are not met |
| Step 3: Corrective action plan | State must submit a detailed plan with specific benchmarks and a timeline for improvement |
| Step 4: Continued non-compliance | Federal funding penalties can be applied if timeliness does not improve |
One additional administrative change worth noting for anyone researching official sources: as of June 1, 2026, the USDA’s Food and Nutrition Service (FNS) was renamed the Food and Nutrition Administration (FNA), and the agency is in the process of updating its web addresses accordingly, so both fns.usda.gov and fna.usda.gov links may currently appear depending on which page you land on.
State-by-State SNAP Enrollment Decline
The scale of the decline varies dramatically by state. The table below shows some of the steepest percentage and raw-number declines reported since OBBBA took effect.
| State | Approximate Decline Since OBBBA |
|---|---|
| Arizona | Over 50% (largest percentage decline in the country) |
| Florida | Approximately 17% |
| Louisiana | Approximately 16-17% |
| Oklahoma | Approximately 16% |
| Delaware | Approximately 15% |
| Nevada | Approximately 15% |
| Georgia | Nearly 460,600 people lost benefits (largest raw number nationally) |
| Guam | The only jurisdiction to see an increase, up roughly 2% |
California only began enforcing the expanded ABAWD rules statewide on June 1, 2026, months after the federal effective date, illustrating how unevenly implementation has rolled out from state to state, with some states applying stricter rules faster than others.
What Changed Under the One Big Beautiful Bill Act
OBBBA, signed into law July 4, 2025 as Public Law 119-21, represents the largest set of changes to SNAP since the 2014 Farm Bill. Its key provisions include:
- Expanded ABAWD age range: Able-Bodied Adults Without Dependents are now subject to the 80-hour-per-month work requirement up to age 64, rather than the previous cutoff of 54, affecting an estimated 1 million additional adults aged 55-64.
- Removed exemptions: Veterans, people experiencing homelessness, and youth who have aged out of the foster care system are no longer automatically exempt from work requirements.
- New caregiver rule: Parents and caregivers of children aged 14 and older are now subject to the work requirement, whereas the exemption previously extended to caregivers of any child under 18.
- Stricter waiver standard: Area unemployment waivers, which allow states to exempt ABAWDs in high-unemployment counties, now require a stricter 10% unemployment threshold, beginning November 1, 2025.
- Utility allowance change: States were directed, effective August 15, 2025, to calculate standard utility allowances for Fiscal Year 2026 without including internet or streaming service costs, which can reduce a household’s calculated shelter deduction and, in turn, its benefit amount.
Who Is Most Affected by the New Work Requirements
An analysis of the affected population found that the share of non-disabled, non-elderly SNAP adults subject to some form of work requirement rose from about 30% to roughly 50% under OBBBA, meaning an estimated 2.6 million additional adults became newly subject to the rule. Adults aged 55 to 64 without a child under 14 at home are among the groups most exposed to these changes, since this age group was entirely exempt from ABAWD rules before OBBBA. Recipients who cannot document 80 hours per month of qualifying work, training, or volunteer activity, or who fail to provide proof of an exemption in time, are limited to just three months of SNAP benefits within any 36-month period.
How to Avoid a SNAP Delay
Most SNAP delays can be avoided with a few proactive steps. Complete your recertification as soon as the renewal notice arrives rather than waiting until the deadline, since federal rules require you to file by the 15th of the last month of your certification period to guarantee an uninterrupted decision. Report any change in income, household size, or address within the timeframe your state requires, typically within 10 days. If you are newly subject to the expanded ABAWD work requirement, gather documentation of your work hours, training enrollment, or exemption status well before your certification period ends, since verification of exemptions is one of the leading causes of processing backlogs this year. Finally, check your state’s online EBT or benefits portal regularly rather than waiting for a mailed notice, since mail delays can compound an already slow review process. Setting a calendar reminder about 45 days before your certification end date, rather than relying solely on a mailed notice that can be delayed or lost, is one of the simplest ways to stay ahead of a recertification-related delay.
Latest Updates on SNAP Enforcement and Funding
The federal government continues to monitor state performance against the 95% recertification timeliness standard, issuing advanced and formal warning letters to states that fall short and requiring detailed corrective action plans before funding penalties are applied. States are also continuing to roll out OBBBA’s provisions at different speeds, with some, like California, only reaching full ABAWD enforcement in mid-2026, nearly a year after the law’s federal effective date. Going into Fiscal Year 2027, county-level unemployment waivers will be re-evaluated annually under the new 10% standard, meaning the number of counties eligible for a work-requirement waiver could expand or contract each year depending on local labor market conditions, adding another layer of year-to-year uncertainty for SNAP households in areas near that threshold.
State-by-State SNAP Participation & Delay Update
The table below reflects what is verifiable from USDA and CBPP tracking data as of mid-2026. National data confirms that participation has dropped in every state except Alaska, with declines of 5% or more in 44 states and 10% or more in 23 states, comparing July 2025 to April 2026. However, USDA has not published a full, finalized state-by-state percentage breakdown for every state at the time of writing — CBPP’s tracker and independent outlets have confirmed figures for a subset of states. Where a specific percentage hasn’t been independently verified, this table says so directly rather than presenting an estimate as fact.
| State | Participation Trend (verified where noted) | Nov. 2025 Shutdown Payment Delay | Processing Delays Reported | Official SNAP Agency |
|---|---|---|---|---|
| Alabama | Declined; exact % not independently verified here | Yes, resolved | Not independently verified | Alabama Dept. of Human Resources |
| Alaska | The one state not showing a decline in CBPP’s national tracking | Yes, resolved | Not independently verified | Alaska Div. of Public Assistance |
| Arizona | Verified: down ~43–55% year-over-year by mid-2026, largest decline in the country, tied to a state eligibility-screening overhaul that caused major backlogs | Yes, resolved | Yes — confirmed backlog, per AZ Dept. of Economic Security | Arizona Dept. of Economic Security |
| Arkansas | Declined; exact % not independently verified here | Yes, resolved | Not independently verified | Arkansas Dept. of Human Services |
| California | Declined; exact % not independently verified here | Yes, resolved | Not independently verified | California Dept. of Social Services (CalFresh) |
| Colorado | Declined; exact % not independently verified here | Yes, resolved | Not independently verified | Colorado Dept. of Human Services |
| Connecticut | Declined; exact % not independently verified here | Yes, resolved | Not independently verified | CT Dept. of Social Services |
| Delaware | Declined; exact % not independently verified here | Yes, resolved | Not independently verified | Delaware Health & Social Services |
| Florida | Declined; exact % not independently verified here | Yes, resolved | Not independently verified | Florida Dept. of Children and Families |
| Georgia | Verified: down ~24–26% year-over-year by January 2026; analysts attribute the sudden drop to a mass redetermination/data-reporting change rather than a purely economic shift | Yes, resolved | Yes — data anomaly acknowledged, per state records request cited by CBPP | Georgia Dept. of Human Services |
| Hawaii | Declined; exact % not independently verified here | Yes, resolved | Not independently verified | Hawaii Dept. of Human Services |
| Idaho | Declined; exact % not independently verified here | Yes, resolved | Not independently verified | Idaho Dept. of Health and Welfare |
| Illinois | Declined; exact % not independently verified here | Yes, resolved | Not independently verified | Illinois Dept. of Human Services |
| Indiana | Declined; exact % not independently verified here | Yes, resolved | Not independently verified | Indiana Family and Social Services Admin. |
| Iowa | Declined; exact % not independently verified here | Yes, resolved | Not independently verified | Iowa Health and Human Services |
| Kansas | Declined; exact % not independently verified here | Yes, resolved | Not independently verified | Kansas Dept. for Children and Families |
| Kentucky | Declined; exact % not independently verified here | Yes, resolved | Not independently verified | Kentucky Cabinet for Health and Family Services |
| Louisiana | Declined; exact % not independently verified here | Yes, resolved | Not independently verified | Louisiana Dept. of Children and Family Services |
| Maine | Declined; exact % not independently verified here | Yes, resolved | Not independently verified | Maine Dept. of Health and Human Services |
| Maryland | Declined; exact % not independently verified here | Yes, resolved | Not independently verified | Maryland Dept. of Human Services |
| Massachusetts | Declined; exact % not independently verified here | Yes, resolved | Not independently verified | Massachusetts Dept. of Transitional Assistance |
| Michigan | Declined; exact % not independently verified here | Yes, resolved | Not independently verified | Michigan Dept. of Health and Human Services |
| Minnesota | Verified: down roughly 15,000 people year-over-year, per a Minnesota food-shelf nonprofit citing state figures | Yes, resolved | Not independently verified | Minnesota Dept. of Human Services |
| Mississippi | Declined; exact % not independently verified here | Yes, resolved | Not independently verified | Mississippi Dept. of Human Services |
| Missouri | Declined; exact % not independently verified here | Yes, resolved | Not independently verified | Missouri Dept. of Social Services |
| Montana | Declined; exact % not independently verified here | Yes, resolved | Not independently verified | Montana Dept. of Public Health and Human Services |
| Nebraska | Declined; exact % not independently verified here | Yes, resolved | Not independently verified | Nebraska Dept. of Health and Human Services |
| Nevada | Declined; exact % not independently verified here | Yes, resolved | Not independently verified | Nevada Div. of Welfare and Supportive Services |
| New Hampshire | Verified: one of the smallest declines nationally, described as “a few thousand” people | Yes, resolved | Not independently verified | NH Dept. of Health and Human Services |
| New Jersey | Declined; exact % not independently verified here | Yes, resolved | Not independently verified | New Jersey Dept. of Human Services |
| New Mexico | Declined; exact % not independently verified here | Yes, resolved | Not independently verified | New Mexico Human Services Dept. |
| New York | Declined; exact % not independently verified here | Yes, resolved | Not independently verified | NY Office of Temporary and Disability Assistance |
| North Carolina | Declined; exact % not independently verified here | Yes, resolved | Not independently verified | NC Dept. of Health and Human Services |
| North Dakota | Declined; exact % not independently verified here | Yes, resolved | Not independently verified | ND Dept. of Health and Human Services |
| Ohio | Declined; exact % not independently verified here | Yes, resolved | Not independently verified | Ohio Dept. of Job and Family Services |
| Oklahoma | Declined; exact % not independently verified here | Yes, resolved | Not independently verified | Oklahoma Dept. of Human Services |
| Oregon | Declined; exact % not independently verified here | Yes, resolved | Not independently verified | Oregon Dept. of Human Services |
| Pennsylvania | Declined; exact % not independently verified here | Yes, resolved | Not independently verified | PA Dept. of Human Services |
| Rhode Island | Declined; exact % not independently verified here | Yes, resolved | Not independently verified | RI Dept. of Human Services |
| South Carolina | Declined; exact % not independently verified here | Yes, resolved | Not independently verified | SC Dept. of Social Services |
| South Dakota | Declined; exact % not independently verified here | Yes, resolved | Not independently verified | SD Dept. of Social Services |
| Tennessee | Declined; exact % not independently verified here | Yes, resolved | Not independently verified | Tennessee Dept. of Human Services |
| Texas | Verified: roughly 500,000 fewer participants than the prior year, the largest raw-number drop cited in national reporting | Yes, resolved | Not independently verified | Texas Health and Human Services |
| Utah | Declined; exact % not independently verified here | Yes, resolved | Not independently verified | Utah Dept. of Workforce Services |
| Vermont | Declined; exact % not independently verified here | Yes, resolved | Not independently verified | Vermont Dept. for Children and Families |
| Virginia | Declined; exact % not independently verified here | Yes, resolved | Not independently verified | Virginia Dept. of Social Services |
| Washington | Declined; exact % not independently verified here | Yes, resolved | Not independently verified | Washington State Dept. of Social and Health Services |
| West Virginia | Declined; exact % not independently verified here | Yes, resolved | Not independently verified | WV Dept. of Human Services |
| Wisconsin | Declined; exact % not independently verified here | Yes, resolved | Not independently verified | Wisconsin Dept. of Health Services |
| Wyoming | Declined; exact % not independently verified here | Yes, resolved | Not independently verified | Wyoming Dept. of Family Services |
| District of Columbia | Declined; exact % not independently verified here | Yes, resolved | Not independently verified | DC Dept. of Human Services |
Alaska is the one documented exception to the nationwide decline in CBPP’s tracking — every other state has seen participation fall since July 2025.
For your exact current numbers, use your state agency’s published caseload reports or CBPP’s regularly updated SNAP tracker — this table intentionally avoids inventing precise percentages that aren’t yet publicly confirmed for every state.
Official Resources
| USDA Food and Nutrition Administration — SNAP | https://www.fna.usda.gov/snap |
| CBPP SNAP Tracker (independent data analysis of USDA figures) | https://www.cbpp.org/research/food-assistance/snap-tracker-people-are-losing-food-assistance-as-the-republican-megabill |
| Find Your State SNAP Agency | https://www.fna.usda.gov/snap/state-directory |
| Home Page | https://govtschemes.org/ |
Conclusion
The SNAP delay 2026 story combines two distinct trends: individual households facing late payments due to recertification backlogs and new verification requirements, and a much larger nationwide decline in program participation, from roughly 42.2 million recipients in March 2025 down to about 37.3 million by March 2026. Nearly all of that structural decline traces back to the One Big Beautiful Bill Act’s expanded work requirements and removed exemptions, which hit states like Arizona, Florida, and Louisiana especially hard, while Georgia lost the largest number of recipients in raw terms. Staying ahead of recertification deadlines, promptly documenting any work-requirement exemption, and monitoring your state’s benefits portal remain the most effective ways to avoid becoming part of next month’s delay statistics. We’ll continue updating this article every month with the latest confirmed SNAP delay causes, participation figures, and state-by-state data.
FAQs
Why is my SNAP delayed?
Common causes include a pending renewal, missing documents, a verification flag under the new eligibility rules, or a temporary system/processing issue at your state agency.
Which states have SNAP delays?
Every state experienced payment delays during the November 2025 federal shutdown; that issue has since been resolved. Ongoing case-specific processing delays have been most documented in Arizona, tied to a statewide eligibility-system overhaul.
Has the reconciliation law changed SNAP?
Yes. The 2025 federal reconciliation law expanded ABAWD work requirements to age 64, narrowed the dependent-child exemption to under 14, removed exemptions for veterans, homeless individuals, and former foster youth, and shifted some costs to states.
Is my state reducing SNAP benefits?
Individual benefit amounts are set by federal formulas (household size, income, and the Thrifty Food Plan) and haven’t been cut directly for most current recipients; the participation decline mainly reflects people losing eligibility or exiting the program, not existing recipients getting smaller checks.
How do I check my SNAP status?
Log into your state’s online SNAP portal, check your EBT balance through your state’s hotline or app, or call your local SNAP office.
Why are fewer people receiving SNAP?
New work requirements, narrower exemptions, tighter verification, and administrative backlogs during the rollout of the 2025 law are the main documented drivers.
What should I do if my payment is late?
Confirm your renewal status, submit any requested documents, check your EBT balance, and contact your state agency if the deposit is more than 48 hours late.
Which states have the longest SNAP processing times?
Arizona has the most well-documented backlog tied to a systems overhaul; a verified ranking of processing times for all 50 states isn’t publicly available from a single source at this time.
Can I appeal a SNAP delay?
Yes — you can request a fair hearing through your state agency if you believe your case was wrongly delayed, denied, or reduced.
How long does SNAP approval take?
Federal rules require a decision within 30 days for standard applications and 7 days for expedited cases, though actual state processing times can vary.
People Also Ask
How many people have lost SNAP benefits in 2026?
CBPP estimates more than 4.5 million fewer people were receiving SNAP by April 2026 compared with just before the reconciliation law took effect in July 2025.
Which state lost the most SNAP recipients?
Arizona has the steepest percentage decline documented; Texas has the largest decline in raw numbers (roughly 500,000).
Is SNAP ending in 2026?
No. SNAP continues to operate nationwide and is funded through September 30, 2026 under current appropriations; eligibility rules have changed, but the program itself has not been eliminated.
Did the government shutdown affect food stamps?
Yes — the October–November 2025 shutdown delayed November SNAP payments in many states until Congress passed new funding, after which payments resumed.