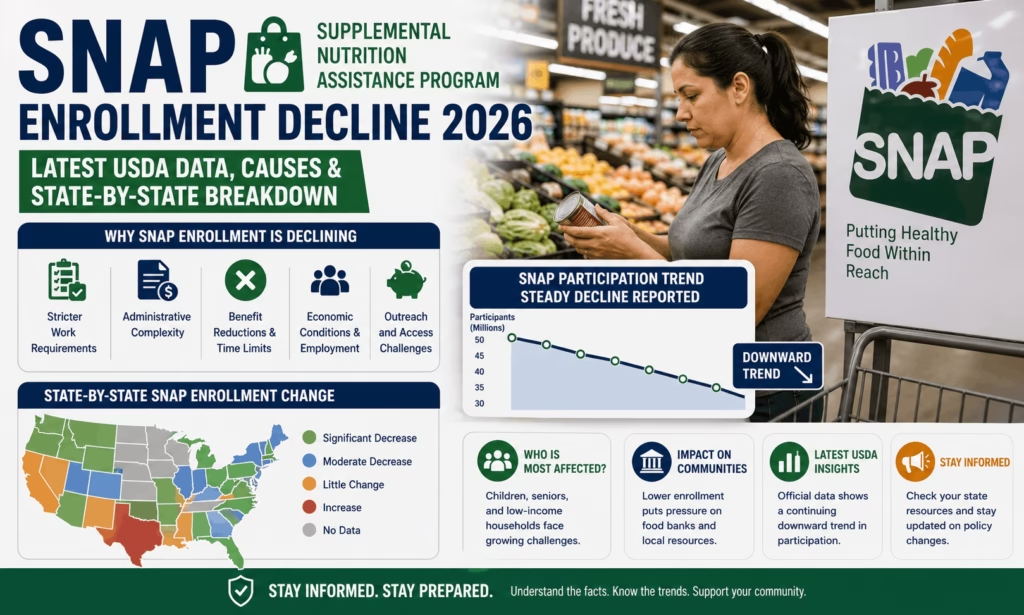
The SNAP enrollment decline now shows up clearly in the U.S. Department of Agriculture’s own monthly participation data, which is the most authoritative and current single source available for this trend. According to the USDA Food and Nutrition Administration’s latest published figures, national SNAP participation fell from approximately 42.8 million recipients in April 2025 to about 37.0 million in April 2026, a drop of roughly 5.8 million people, or about 13.5%, over twelve months. USDA publishes this data with a three-to-six month reporting lag, so April 2026 is currently the most recent confirmed month available, and this article uses that single dataset consistently throughout rather than mixing figures pulled from different reporting periods, which is where a lot of confusion around this topic tends to come from. We’ll be updating this article monthly as USDA releases newer confirmed participation data, so the numbers here will always reflect the latest available month rather than an outdated snapshot.
This guide walks through exactly what the confirmed USDA numbers show, why relying on a single consistent data source matters when so many secondary sources report slightly different percentages, what is actually driving the SNAP enrollment decline, and which states have been affected most. It also covers who is losing eligibility and why, whether the pace of decline is speeding up or slowing down, and what the trend means if you are still enrolled in the program. If you have seen conflicting numbers about how many people have lost SNAP benefits this year, this breakdown sticks to one clearly sourced dataset so you get a consistent, accurate picture.
SNAP Enrollment Decline 2026 Summary
| Detail | Figure |
|---|---|
| Data source | USDA Food and Nutrition Administration, monthly SNAP participation data |
| National SNAP participation, April 2025 | Approximately 42.8 million |
| National SNAP participation, April 2026 (latest confirmed) | Approximately 37.0 million |
| Total decline | Approximately 5.8 million people, about 13.5% |
| Comparison to pre-pandemic baseline (Sept 2019) | Still roughly 4% above pre-pandemic enrollment |
| Primary driver of the decline | One Big Beautiful Bill Act (OBBBA), signed July 4, 2025 |
| USDA data reporting lag | 3 to 6 months |
| Full state compliance deadline for OBBBA work rules | November 1, 2025 |
| Estimated 10-year federal spending reduction (CBO) | Approximately $186 billion |
The Latest Confirmed SNAP Enrollment Numbers
The most current, directly USDA-sourced figure available shows national SNAP participation at approximately 37.0 million people as of April 2026, down from about 42.8 million in April 2025. This 13.5% year-over-year decline is one of the steepest single-year drops in the program’s history outside of a major economic recovery period, and it stands out because it happened during a period of relatively stable overall economic conditions, meaning the decline is largely policy-driven rather than reflecting fewer people needing assistance. Even after this drop, current enrollment remains about 4% above the pre-pandemic level recorded in September 2019, when roughly 35.7 million people participated in the program.
A Note on Data Timing and Why Figures Vary
If you have seen different percentages or totals reported elsewhere for the SNAP enrollment decline, the most common reason is that different sources compare different months. USDA’s own reporting carries a three-to-six month lag, so a source citing March 2026 data, a source citing February 2026 data, and a source citing April 2026 data will all show slightly different totals and percentages, even though none of them are necessarily wrong. Some analyses also start their comparison from January 2025, others from March or July 2025, which changes both the total decline and the percentage depending on how much of the pre-OBBBA baseline period is included. This article uses April 2025 to April 2026 consistently, USDA’s most recently published complete month-over-month comparison, specifically to avoid the inconsistency that shows up when figures from different reporting windows get mixed together.
What Is Driving the SNAP Enrollment Decline
The primary driver behind this decline is the One Big Beautiful Bill Act (OBBBA), signed into law July 4, 2025, which made the most significant changes to SNAP eligibility rules since the 2014 Farm Bill. Its key provisions include:
- Expanded work requirement age range: Able-Bodied Adults Without Dependents (ABAWDs) are now subject to the 80-hour-per-month work requirement up to age 64, up from the previous cutoff of 54.
- Removed automatic exemptions: Veterans, people experiencing homelessness, and former foster youth are no longer automatically exempt from work requirements.
- New caregiver rule: Parents and caregivers of children aged 14 and older are now subject to work requirements, whereas the exemption previously covered caregivers of any child under 18.
- Stricter unemployment waiver standard: Area-based work requirement waivers now require a stricter local unemployment threshold, reducing the number of counties that qualify for an exemption.
States were required to reach full compliance with these rules by November 1, 2025, and the Congressional Budget Office estimates the combined changes will reduce federal SNAP spending by roughly $186 billion over ten years, primarily by removing an estimated 2.4 million people from the program in an average month nationally.
State-by-State SNAP Enrollment Changes
Enrollment declines have varied significantly by state, driven by differences in each state’s caseload composition, how quickly it implemented the new federal rules, and local economic conditions. Some of the most notable state-level patterns reported since OBBBA took effect include:
| State | Reported Change Since OBBBA |
|---|---|
| Arizona | Among the steepest percentage declines nationally |
| Georgia | Large numeric drop, though a portion is attributed to a data and redetermination reporting adjustment rather than pure policy effect |
| Texas | One of the largest declines in raw number of recipients |
| Florida | Notable double-digit percentage decline |
| Louisiana and Oklahoma | Notable double-digit percentage declines |
A small number of states and territories, including Alaska in some reporting periods, have shown little to no decline or even a slight increase, generally reflecting local implementation timing or unique caseload characteristics rather than an exception to the national work-requirement rules. Because exact state-level percentages vary somewhat by which reporting month and data source is used, readers researching a specific state should check that state’s own SNAP agency or the USDA’s official state-level data tables directly for the most precise current figure.
OAS Payment Increase August 2026: Confirmed Amounts, Payment Date, and the Annual GIS Reset !
Canada GST Top-Up Payment 2026 Fact Check, Eligibility, Payment Date & Amount!
$994 SSI Payment August 2026: The Real Deposit Date and Who Actually Gets Paid?
Who Lost Eligibility and Why
An analysis of SNAP’s affected population found that the share of non-disabled, non-elderly adult recipients subject to some form of work requirement rose from about 30% to roughly 50% under OBBBA, an estimated 2.6 million additional adults newly subject to the rule. Adults aged 55 to 64 without a child under 14 at home represent one of the largest newly affected groups, since this age range was entirely exempt from work requirements before OBBBA took effect. Recipients who cannot document 80 hours per month of qualifying work, training, or approved volunteer activity, or who fail to submit proof of a valid exemption in time, are limited to just three months of benefits within any 36-month period, which is the mechanism behind much of the enrollment decline at the individual household level.
It is worth distinguishing between two different reasons a household might disappear from the enrollment count. Some households genuinely no longer meet the eligibility rules, for example an ABAWD who cannot find 80 hours of qualifying activity in a given month. Others remain eligible on paper but lose benefits temporarily due to a paperwork or verification gap, such as a caseworker not yet confirming a submitted exemption before a deadline passes. National enrollment data does not distinguish between these two categories, so a portion of the decline likely reflects administrative friction during a large, fast-moving rule change rather than a permanent loss of eligibility for every household counted.
Is the Decline Slowing Down or Speeding Up
Enrollment held relatively steady through the first half of 2025, before OBBBA’s provisions took effect, and the steepest month-over-month drops occurred in the months immediately surrounding the November 1, 2025 full compliance deadline, as states implemented new verification and work-requirement processes all at once. More recent data suggests the pace of decline has moderated somewhat compared to that initial implementation period, though participation has continued trending downward each month through the most recently confirmed USDA data. Because area unemployment waivers are scheduled for annual re-evaluation under the new, stricter threshold beginning in Fiscal Year 2027, the number of counties qualifying for a work-requirement exemption could shift again depending on local labor market conditions, which may affect the pace of future enrollment changes.
What This Means for Remaining SNAP Households
If you are still enrolled in SNAP, the enrollment decline itself does not directly affect your own case, but it does reflect a broader shift toward stricter verification and more frequent eligibility reviews across the program. Households newly subject to the expanded work requirement should keep documentation of work hours, training enrollment, or a qualifying exemption readily available well before each recertification date, since verification delays are one of the most common reasons households lose benefits even when they remain technically eligible. Checking your state’s SNAP portal regularly, rather than relying solely on mailed notices, is one of the most effective ways to avoid an unexpected loss of benefits tied to a missed documentation deadline.
Official SNAP Data Resources
| Resource | Purpose | Official Link |
|---|---|---|
| USDA FNA SNAP Data Tables | Official monthly national and state-level participation figures | fna.usda.gov/pd/supplemental-nutrition-assistance-program-snap |
| USDA FNA Program Participation Dashboard | Interactive visualization of national and state SNAP trends | fna.usda.gov/data-research/data-visualization/program-participation |
| USDA FNA SNAP Eligibility | Federal eligibility rules and income limits | fna.usda.gov/snap |
| SNAP State Directory | Find your state’s SNAP application and case management portal | fna.usda.gov/snap/state-directory |
| Congressional Budget Office | Federal spending and participation impact estimates | cbo.gov |
FAQs
How many people are currently enrolled in SNAP?
According to the most recently published USDA data, approximately 37.0 million people were enrolled as of April 2026, the latest confirmed month available given the agency’s standard three-to-six month reporting lag.
Why do different articles report different SNAP decline percentages?
Most discrepancies come from comparing different date ranges, since USDA’s reporting lag means various sources cite figures from different months, which changes both the total decline and the percentage shown.
What caused the SNAP enrollment decline in 2026?
The primary driver is the One Big Beautiful Bill Act, signed July 4, 2025, which expanded work requirements to age 64, removed several previous exemptions, and tightened the standard for local unemployment waivers.
Which states have seen the biggest SNAP enrollment drops?
Arizona has reported among the steepest percentage declines, while Texas and Georgia have reported some of the largest declines in raw number of recipients, though Georgia’s figure includes a data reporting adjustment.
Is SNAP enrollment expected to keep declining?
Participation has continued trending downward through the most recent confirmed USDA data, though the pace has moderated somewhat compared to the sharpest drops recorded around the November 2025 compliance deadline.
Does losing SNAP mean a household’s income increased?
Not necessarily. A large share of the decline is tied to new work-requirement documentation and verification rules rather than households becoming ineligible due to higher income.
Where can I check the official SNAP enrollment data myself?
The USDA Food and Nutrition Administration publishes monthly national and state-level participation tables directly on its official data pages, which is the most reliable way to confirm current figures.
Why does USDA’s SNAP data lag several months behind the current date?
States report participation figures to the federal government on a schedule that takes time to compile, verify, and publish accurately, which is why the most recently available confirmed month is typically three to six months behind the current calendar month rather than reflecting real-time enrollment.
People Also Ask
Is SNAP enrollment still above pre-pandemic levels? Yes. Even after the 2025-2026 decline, national enrollment remains about 4% above the September 2019 pre-pandemic baseline of roughly 35.7 million recipients.
Did the SNAP enrollment decline happen because the economy improved? Unlike past enrollment declines tied to economic recovery, this decline occurred during a period of relatively stable economic conditions and is largely attributed to policy changes under OBBBA rather than falling need.
How much money will the federal government save from the SNAP enrollment decline? The Congressional Budget Office estimates OBBBA’s SNAP provisions will reduce federal spending by approximately $186 billion over ten years.
Can someone who lost SNAP benefits reapply later? Yes. Households that lose benefits due to work-requirement time limits or a missed recertification can generally reapply once they meet current eligibility and documentation requirements again.
Conclusion
The SNAP enrollment decline is clearly documented in USDA’s own data, which shows participation falling from approximately 42.8 million people in April 2025 to about 37.0 million by April 2026, a drop of roughly 13.5% tied primarily to the One Big Beautiful Bill Act’s expanded work requirements and removed exemptions. Because USDA’s data carries a reporting lag and different sources often compare different time periods, figures can appear inconsistent even when each one is individually accurate, which is why this breakdown sticks to a single, clearly labeled dataset throughout rather than blending numbers pulled from several different months. For households still enrolled, staying ahead of recertification deadlines and documenting any work-requirement exemption remains the most effective way to avoid becoming part of next month’s decline statistics. We’ll continue updating this article every month as USDA publishes newer confirmed enrollment data.
Also Read
$2000 Tariff Dividend August 2026: Is It Still Coming? Full Fact-Check Update
SNAP Delay 2026: Payment Delays, Benefit Changes, Participation Decline & State-by-State Breakdown
Canada Pension Plan Payment August 27th, 2026: Who Will Receive CPP Benefits and How Much?
$2000 Stimulus Payment 2026 Fact-Check: Is It Really Coming?
Social Security COLA 2026: How Much Extra Will You Receive in Your Aug 2026 Benefit Payment?