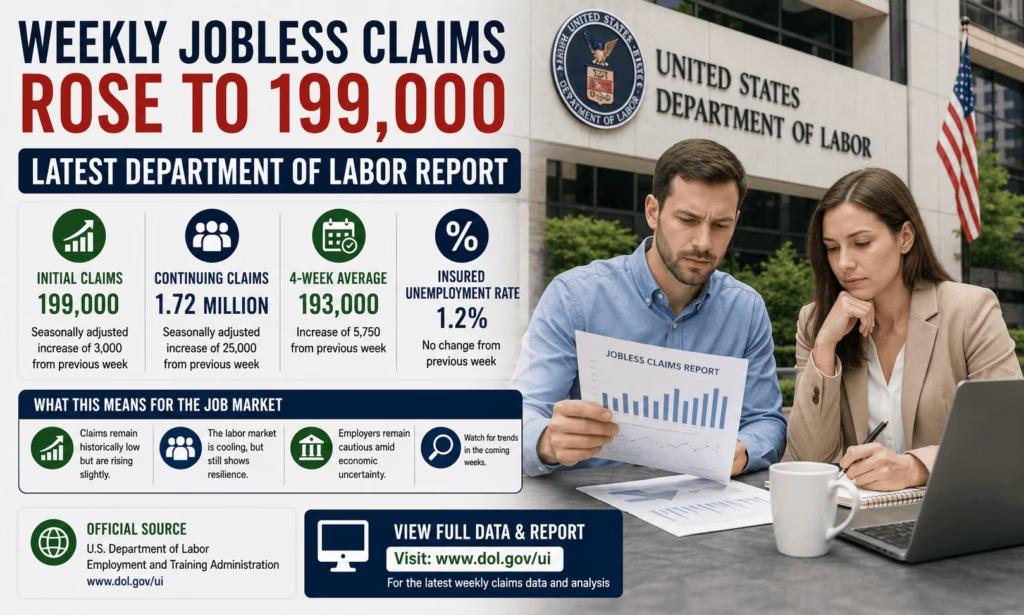
Weekly Jobless Claims Report: New unemployment numbers out of Washington are adding fresh weight to the idea that the red-hot US job market of the past few years is finally losing some steam. According to the latest weekly jobless claims report from the US Department of Labor, initial claims for unemployment benefits climbed to 199,000 for the week ending August 1, up by 1,000 from the prior week’s revised total of 198,000. The number came in below what economists on Wall Street had penciled in, but the underlying trend, taken together with continuing claims data, is pointing toward a labor market that is cooling gradually rather than crashing.
The 4-week moving average, a smoother measure that irons out weekly noise, came in at 198,750, actually a decrease of 4,500 from the previous week’s revised average. Continuing claims, which track people who are still receiving benefits after their first week, rose by 24,000 to 1,801,000 for the week ending July 25. The insured unemployment rate held steady at 1.2 percent. We’ll be updating this article monthly as new Department of Labor data becomes available, so bookmark this page if you’re tracking the US unemployment claims trend over time.
Week’s Unemployment Claims Data Key Highlights
| Metric | Latest Figure | Previous Week | Change |
|---|---|---|---|
| Initial jobless claims (week ending Aug 1) | 199,000 | 198,000 (revised) | +1,000 |
| 4-week moving average | 198,750 | 203,250 (revised) | -4,500 |
| Continuing claims (week ending July 25) | 1,801,000 | 1,777,000 | +24,000 |
| Insured unemployment rate | 1.2% | 1.2% | Unchanged |
| Report release schedule | Every Thursday, 8:30 AM ET |
What This Week’s Jobless Claims Report Actually Shows
On the surface, 199,000 new filings is still historically low. Compare that to the depths of the 2020 pandemic, when weekly claims spiked past six million, and the current number looks almost reassuring. But economists watching the initial jobless claims trend aren’t focused on the raw number in isolation. They’re watching the direction of travel, and that direction has been gently upward over the past several months, even as it stays within a range that most would call a low unemployment environment.
The Department of Labor’s Unemployment Insurance Weekly Claims report is considered one of the most timely economic indicators available, since it comes out every week rather than monthly like the official jobs report. That makes it a favorite among traders, economists, and financial journalists trying to get an early read on where hiring and layoffs are headed before the more comprehensive nonfarm payrolls data lands.
SSDI Fast-Track Approval 2026: Compassionate Allowances, QDD
Quebec Experience Program 2026: PEQ Reopening Dates, Eligibility
$5000 CRA Data Breach Settlement 2026: Who Qualifies and How to Claim
H-1B 60-Day Grace Period Elimination: What US Visa Workers Should Know
Continuing Claims and the Insured Unemployment Rate
While initial claims tell you how many people are newly filing for benefits, continuing claims tell a different part of the story: how long people are staying unemployed once they lose a job. The rise to 1,801,000 continuing claims suggests that while layoffs themselves remain contained, it may be taking laid-off workers somewhat longer to find new jobs than it did a year or two ago. This is a pattern several regional Federal Reserve officials have flagged in recent commentary, describing a labor market where hiring has slowed even though mass layoffs have not materialized.
The insured unemployment rate, which measures the share of covered workers actively receiving benefits, has stayed at 1.2 percent, a level consistent with what the Federal Reserve has previously characterized as close to full employment. That steadiness is one reason many economists are avoiding the word “recession” and instead describing this as a gradual normalization after several unusually tight years for hiring.
Why the Weekly Jobless Claims Report Matters for the US Economy
Financial markets treat the weekly unemployment claims release as a pulse check on the broader economy. A reading that comes in meaningfully above forecasts tends to unsettle stocks and boost expectations of Federal Reserve rate cuts, since it signals softer demand for labor. A lower than expected number tends to do the opposite, reinforcing the idea that the economy remains resilient.
This week’s figure, coming in below the median forecast of around 202,000, was read by most analysts as a mild positive, even though it represented an increase from the week before. The bond market’s reaction to jobless claims has become especially sensitive in recent months as investors try to anticipate the Federal Reserve’s next move on interest rates, with weak labor data generally strengthening the case for rate cuts and strong data doing the reverse.
Canada Set to Finalize LNG Agreement With Germany’s SEFE for Ksi Lisims LNG Project
New UK Immigration Rules 2026: What Changes for Visa Applicants?
450,000 Borrowers Student Debt Erased: How to Check If You Qualify?
Is the US Labor Market Actually Softening?
There is no single week of data that settles this question, and economists are genuinely split on how to characterize what is happening. Some argue that the gradual increase in continuing claims, paired with slower private-sector hiring reported in recent ADP data, is early evidence of a cooling job market. Others point out that initial claims remain well below the levels seen during past economic slowdowns, and that a insured unemployment rate near historic lows does not fit the profile of a labor market in real distress.
What most agree on is that hiring has become more selective. Companies appear less willing to lay off workers en masse, but they also appear less eager to hire aggressively, a dynamic sometimes described as a “low-hire, low-fire” labor market. That combination can produce exactly the pattern seen in recent data: claims that inch higher without spiking, alongside a continuing claims number that suggests job searches are taking longer.
Official Resources: Where to Check Unemployment Claims Data and File a Claim
| Resource | Purpose | Official Link |
|---|---|---|
| US Department of Labor UI Weekly Claims Report | Latest national data (PDF), released every Thursday | https://www.dol.gov/ui/data.pdf |
| FRED Initial Claims (ICSA) | Historical weekly claims data and charts | https://fred.stlouisfed.org/series/ICSA |
| DOL Office of Unemployment Insurance | Archive of past weekly claims releases | https://oui.doleta.gov/unemploy/claims_arch.asp |
| CareerOneStop State Unemployment Offices Directory | Find your state’s unemployment office to file a new claim or check your claim status | https://www.careeronestop.org/LocalHelp/UnemploymentBenefits/find-unemployment-benefits.aspx |
| USAGov Unemployment Benefits Guide | General eligibility, registration, and application guidance | https://www.usa.gov/unemployment-benefits |
Note: Weekly jobless claims are a national economic indicator compiled by the Department of Labor from state-level filings. There is no single federal login or registration portal for filing an individual claim. To register for benefits, check your claim status, or log in to manage an existing claim, you need to go through your specific state’s unemployment insurance agency, which you can locate using the CareerOneStop directory above.
FAQs
What are weekly jobless claims and why do they matter?
Weekly jobless claims measure how many people filed for unemployment benefits for the first time in a given week. Economists and investors use the number as an early, high-frequency signal of labor market health, since it is released weekly rather than monthly.
What is the current jobless claims number this week?
Initial claims came in at 199,000 for the week ending August 1, according to the Department of Labor. This was an increase of 1,000 from the previous week’s revised figure of 198,000.
Are jobless claims of 199,000 considered high or low?
Historically, 199,000 remains a low number. Claims regularly ran well above 300,000 during past economic slowdowns and spiked into the millions during 2020. Even with the recent uptick, current claims remain in territory consistent with a relatively healthy labor market.
What is the difference between initial claims and continuing claims?
Initial claims count people filing for unemployment benefits for the first time after losing a job. Continuing claims count people who are still receiving benefits in subsequent weeks, which reflects how long it is taking unemployed workers to find new jobs.
Does a rise in jobless claims mean a recession is coming?
Not necessarily. A single weekly increase, or even several weeks of gradual increases, does not by itself indicate a recession. Economists typically look for a sustained, sharp rise well above the current range, combined with weakness in other indicators like nonfarm payrolls and the unemployment rate, before drawing that conclusion.
How often is the jobless claims report released?
The Department of Labor publishes the Unemployment Insurance Weekly Claims report every Thursday at 8:30 AM Eastern Time, with exceptions when a Thursday falls on a federal holiday.
Where can I check my own unemployment claim status?
Individual claim status must be checked through your state’s unemployment insurance agency, not through the federal Department of Labor report. Use the CareerOneStop state directory linked above to find your state’s official portal.
How do weekly jobless claims affect the stock market?
Markets often react to whether claims come in above or below economist forecasts. Higher than expected claims can raise expectations of Federal Reserve rate cuts, sometimes lifting bond prices, while lower than expected claims can do the opposite by reinforcing confidence in economic resilience.
Conclusion
This week’s jobless claims report paints a picture of a labor market that is shifting gradually rather than dramatically. At 199,000 initial claims and a 4-week average trending slightly lower, the numbers still sit comfortably within a historically healthy range. At the same time, the steady climb in continuing claims to 1,801,000 suggests that once someone loses a job, finding the next one is taking a little longer than it used to. Neither figure points to an economy in crisis, but together they support the broader narrative economists have been describing for months: a labor market that is cooling at the edges even as it avoids a sharp downturn. As always, next week’s release from the Department of Labor will add another data point to that story, and this article will be updated as new figures come in.
SSDI Fast-Track Approval 2026: Compassionate Allowances, QDD
Quebec Experience Program 2026: PEQ Reopening Dates, Eligibility
$5000 CRA Data Breach Settlement 2026: Who Qualifies and How to Claim
H-1B 60-Day Grace Period Elimination: What US Visa Workers Should Know